
Unsupervised learning: revealing the invisible in the age of artificial intelligence
Introduction
In the age of Big Data and artificial intelligence, we produce phenomenal masses of data every day: texts, images, videos, transactions, digital signals. Yet the majority of this data is devoid of labels explaining its content.
How can value be extracted without intensive human intervention?
Unsupervised learning responds to this challenge: by automatically identifying hidden structures and patterns, it revolutionizes data analysis in sectors as varied as healthcare, finance and marketing.
Let's find out why this pillar of machine learning has become indispensable.
What is unsupervised learning?
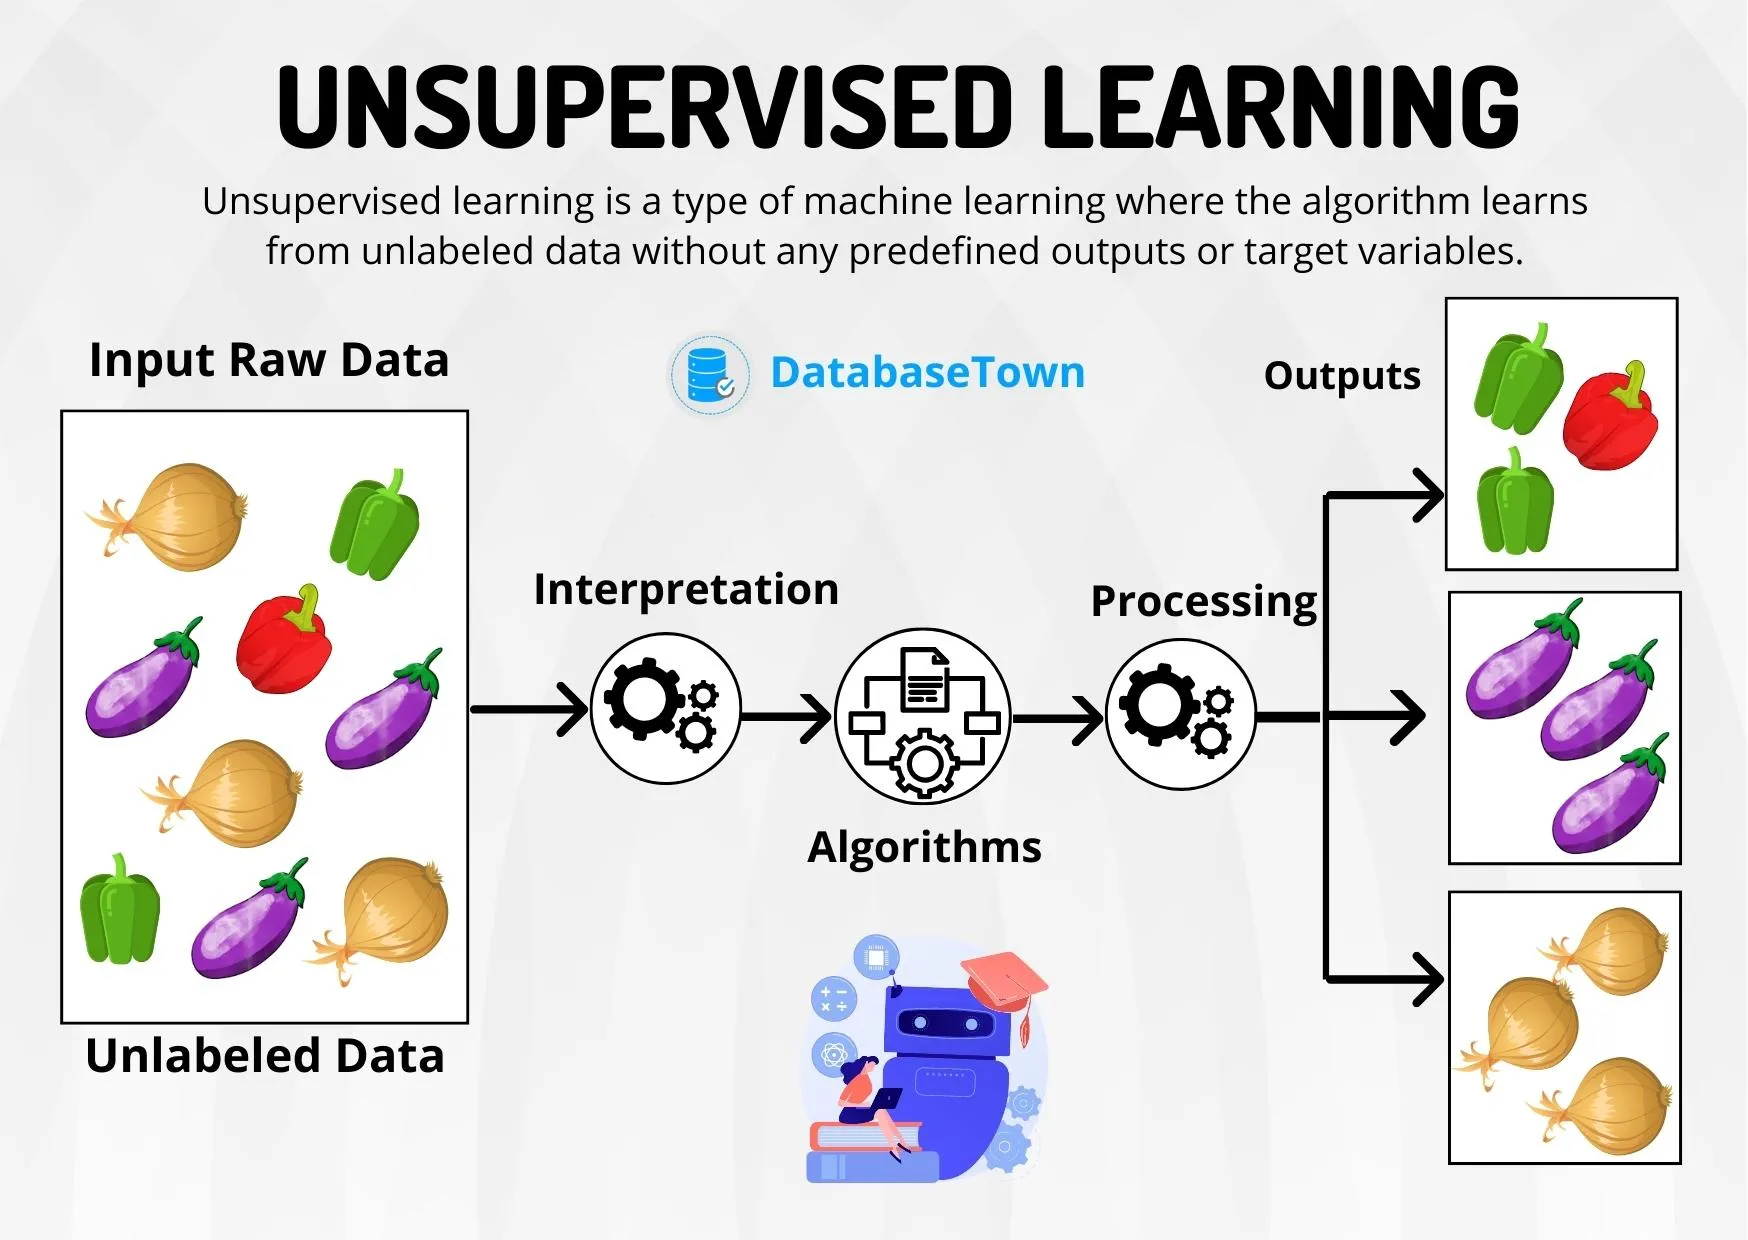
Unsupervised learning refers to a category of machine learning where algorithms must detect patterns in unlabeled data, i.e. without any prior indication of their meaning.
Unlike supervised learning, which associates each input with a specific output, unsupervised learning aims to discover structures intrinsic to the data.
Objective: organize, segment or simplify data, without prior knowledge.
How does unsupervised learning work?
Unsupervised learning is based mainly on three major techniques:
Clustering: grouping similar data together
Clustering is a central technique in unsupervised learning, involving the automatic grouping of similar data without prior labeling. The aim is to discover hidden patterns or structures in the data.
🔍 Basic principle
The clustering algorithm assigns each piece of data to a group (or cluster) according to its similarity to the others. This similarity criterion often depends on a distance measure (such as Euclidean distance).
For example, if you give an algorithm points representing customers (with characteristics such as age and spending), it will be able to group them into typical profiles (young spenders, thrifty retirees, etc.) without knowing in advance how many types exist or their characteristics.
⚙️ Popular clustering algorithms
- K-Means
- Divide the data into k clusters, minimizing the distance between the points and the cluster center.
- Requires k to be defined in advance.
- Simple, fast, but sensitive to outliers.
- DBSCAN (Density-Based Spatial Clustering of Applications with Noise)
- Group dense points together.
- Identifies outliers naturally.
- No need to define k, but parameters such as the epsilon distance.
- Effective for complex shapes.
- Hierarchical Clustering
- Creates a hierarchy of clusters (a kind of tree or dendrogram).
- Not always necessary to fix k.
- Can be agglomerative (bottom-up) or divisive (top-down).
🧠 Applications
- Customer segmentation in marketing.
- Detecting communities in social networks.
- Image compression (grouping similar pixels).
- Analysis of documents or texts (hidden themes).
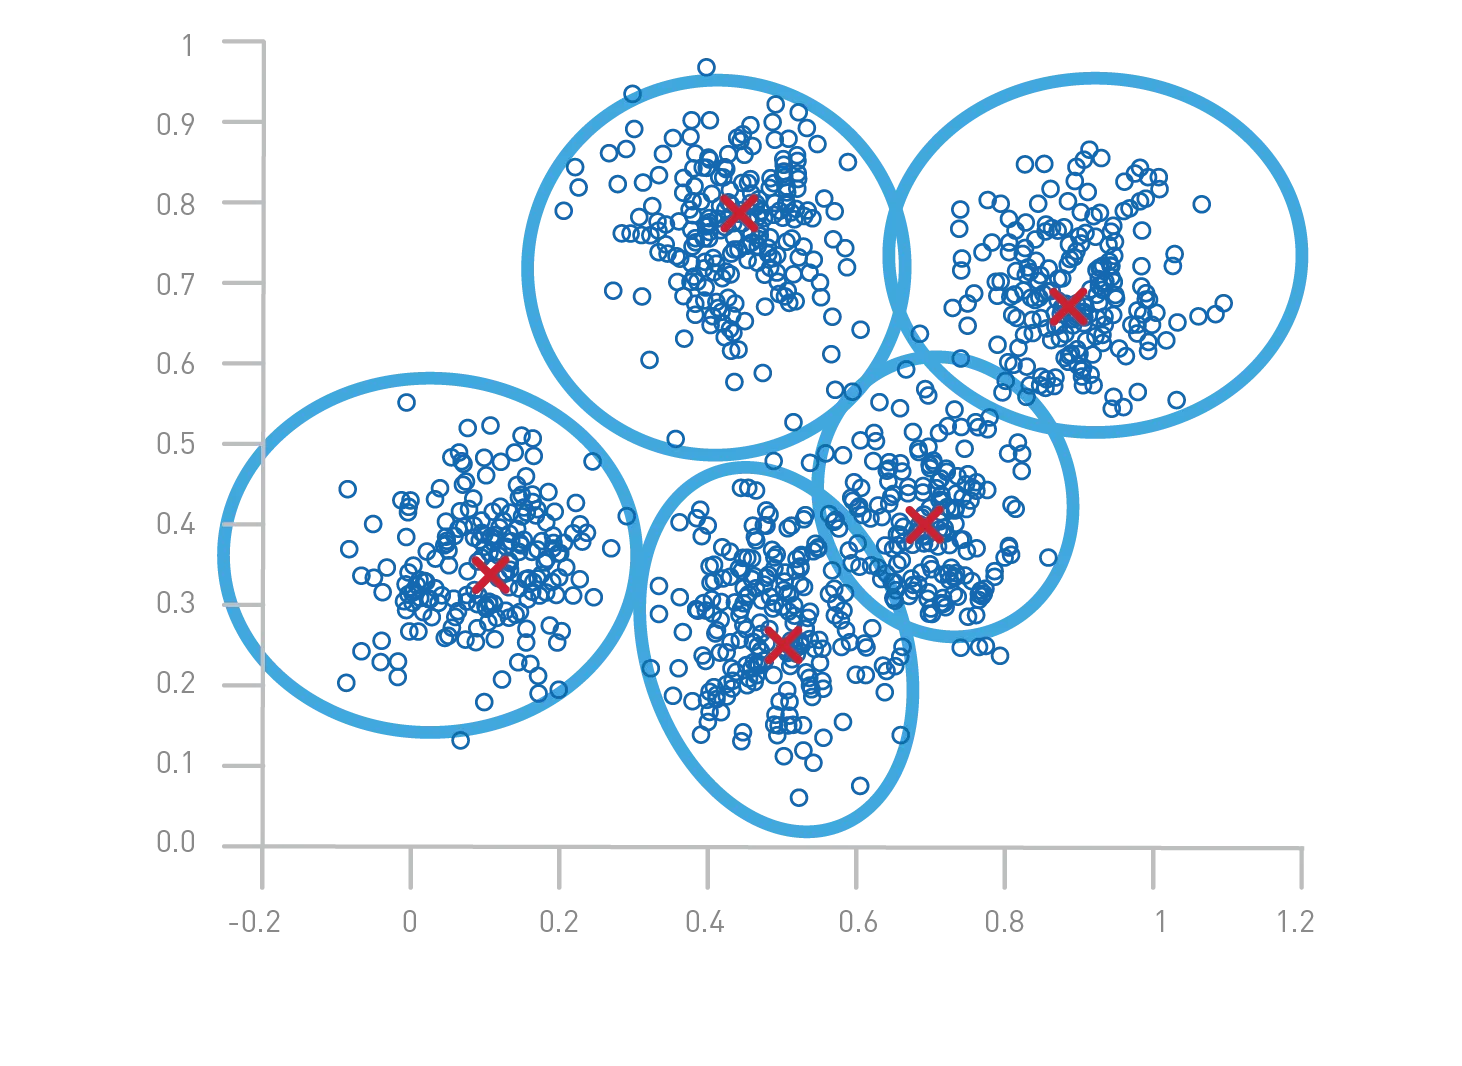
Illustration of K-Means clustering
Image explanation
- Colored dots: Each dot represents a piece of data. The colors indicate the cluster to which the point has been assigned.
- Cluster centers: The large red crosses mark the centers (centroids) calculated for each cluster.
- Separation: Points are grouped according to their proximity to these centers, forming distinct groups.
K-Means clustering steps
- Initialization: Randomly select k centers (here, 3).
- Assignment: Assign each point to the nearest center.
- Update: Recalculate the centers by taking the average of the points in each cluster.
- Repeat: Repeat steps 2 and 3 until convergence (centers no longer change significantly).
Typical applications
- Customer segmentation: Identify groups of customers with similar behaviors.
- Image analysis: group pixels together to segment an image.
- Biology: Classify species or cells according to their characteristics.
📌 To remember
- It's unsupervised: no "right answers" known in advance.
- Success often depends on the quality of the data, the distance chosen, and the right choice of algorithm.
- Good clustering should produce groups that are internally coherent and distinct from one another.
Dimensionality reduction: simplifying without losing essence
Dimensionality reduction is anunsupervised learning technique used to simplify complex data, while preserving its essential structure. It is particularly useful when data have many variables (dimensions), making them difficult to visualize, process or interpret.
🎯 Objective
Reduce the number of variables (or characteristics) while :
- Minimizing information loss;
- Eliminating noise and redundancy;
- Facilitating visualization (often in 2D or 3D);
- Improving the efficiency of algorithms such as clustering.
⚙️ Main methods
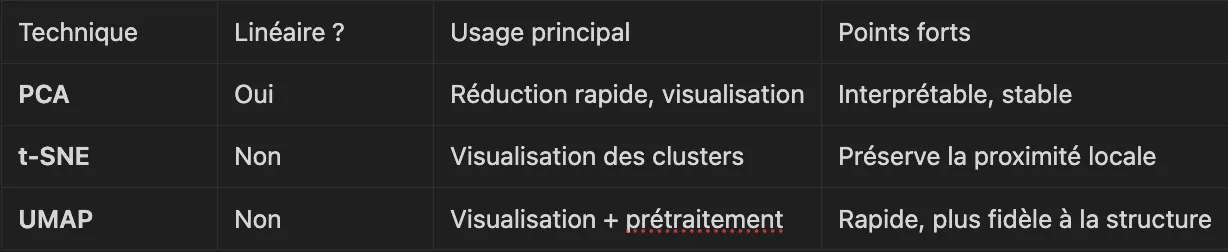
1. PCA (Principal Component Analysis)
- Transforms the initial variables into a new space of variables called principal components, which are orthogonal (uncorrelated).
- The first components capture the maximum possible variance in the data.
- Used to visualize data in 2D/3D while retaining the essential structure.
Advantages: fast, simple, interpretable.
Disadvantage: assumes linear data.
2. t-SNE (t-distributed Stochastic Neighbor Embedding)
- Non-linear technique that preserves local proximity between points.
- Excellent for visualizing hidden clusters in data.
Benefits: great for visualizing complex data.
Disadvantages: slower, uninterpretable, not reusable for new data.
3. UMAP (Uniform Manifold Approximation and Projection)
- Recent alternative to t-SNE, faster while preserving global and local data structure.
- Useful for visualization and pre-processing before clustering.
Advantages: faster than t-SNE, good balance between local and global.
Disadvantages: more complex to set up.
🧠 Practical example
You have a dataset with 100 variables to describe each individual (age, income, scores, etc.).
It's illegible and visually unworkable.
But with PCA, you can reduce this to 2 or 3 main dimensions while retaining 80-90% of the information → you can then apply clustering or visualize the groups with colors.
📌 In a nutshell
Detecting anomalies: spotting the unusual
Anomaly detection (or outlier detection) in unsupervised learning involves identifying data that deviates strongly from the overall behavior of the dataset, without knowing in advance what an "anomaly" is.
This is a crucial task in many areas where abnormal data may indicate problems, fraud, or rare events to be monitored.
🎯 Objective
Isolate the points that don 't resemble the majority of the others.
In an unlabeled data set, the algorithm learns the normal structure, then detects atypical cases.
⚙️ Main methods
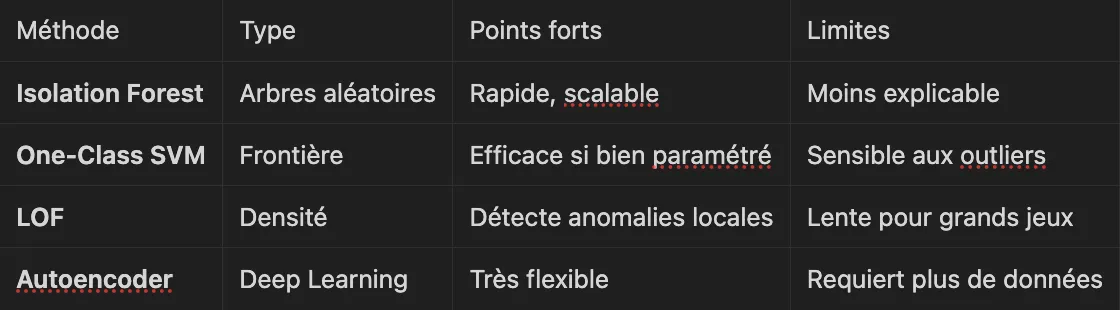
1. Forest insulation
- Based on the idea that anomalies are easier to isolate than normal points.
- Creates random partition trees to divide data: anomalies are isolated in just a few divisions.
Advantages: Fast, efficient even for large datasets.
Disadvantages: Less interpretable.
2. One-Class SVM
- SVM-derived model that learns the normal class boundary.
- Any point too far from this boundary is considered abnormal.
Advantages: good for low-dimensional data sets.
Disadvantages: sensitive to data parameters and scale.
3. Density-based methods (e.g. LOF - Local Outlier Factor)
- Compare the local density around each point with that of its neighbors.
- A point is abnormal if it is much less dense than its neighbors.
Benefits: detects contextual anomalies.
Disadvantages: less suitable for very large dimensions.
4. Autoencoders (deep learning)
- Neural network trained to reconstruct normal data.
- If a piece of data is badly reconstructed → it is probably abnormal.
Advantages: very powerful on complex data (images, time series).
Disadvantages: need for a certain volume of data and tuning.
🧠 Applications
- Fraud detection (credit card, insurance)
- Industrial machine monitoring (predictive maintenance)
- Intrusion detection in cybersecurity
- Health analysis (unusual vital signs)
📌 In a nutshell
Practical applications of unsupervised learning
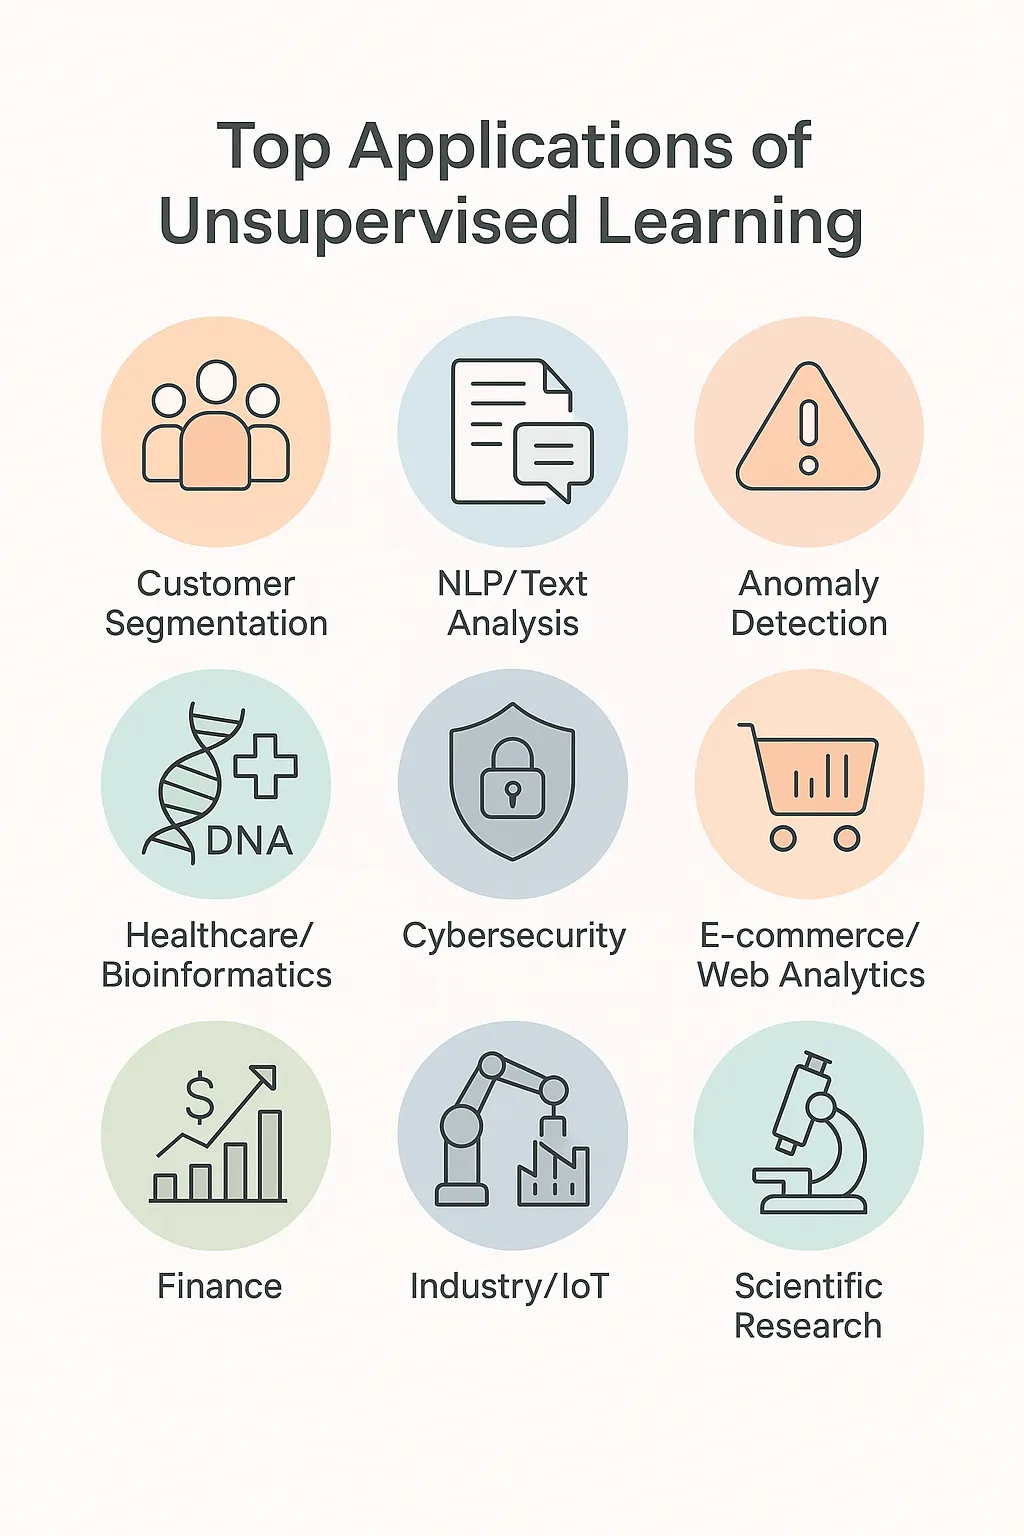
The potential of unsupervised learning is illustrated in a variety of fields:
- Customer segmentation: distinguish groups of users with similar purchasing behavior.
- Behavioral analysis: understanding user journeys without labeling.
- Recommendation systems: suggest content based on implicit similarity between users.
- Fraud detection: spot atypical financial transactions.
- Medical diagnosis: discover disease subtypes in biomedical databases.
- Scientific exploration: mapping complex data in biology or astronomy.
Why is unsupervised learning increasingly crucial?
Faced with the enormous growth of unstructured data, unsupervised learning is becoming essential for :
- Save time and reduce dependence on human annotation.
- Discover patterns invisible to analysts.
- Facilitate the analysis of massive and complex data.
What's more, it is now fuelling major advances in artificial intelligence: self-supervised models, latent representations in neural networks, pre-training techniques for modern machine learning.
Conclusion
Unsupervised learning opens up a new frontier for data analysis: it enables us to navigate the unknown, explore the invisible and optimize our understanding of the digital world.
At a time when data volumes are exploding, mastering these techniques is becoming a strategic lever in every sector.
How do you think we can make unsupervised learning more interpretable and accessible?
Read also


Dive into AI with our in-depth resources.
.webp)

